


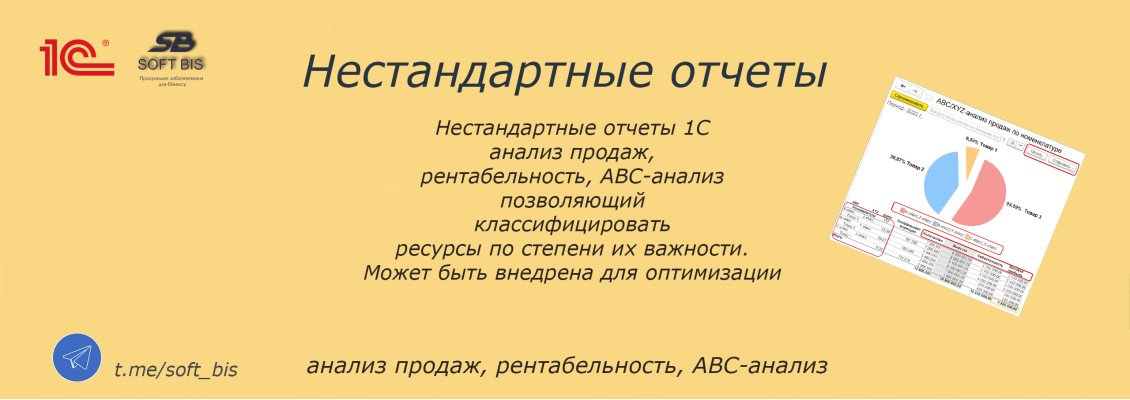
Non-standard reports in 1C: sales analysis, profitability, ABC\ - analysis
Standard reports in 1C are a useful thing. They allow you to quickly get data on the company's balances,
turnover, sales, and finances. But in practice, such reports are often not enough.
The manager needs to see not only the numbers, but also understandwhat is behind them**:
which positions and services bring significant profit, how effective
sales managers are, and how profitability changes by product range or
division. These are all tasks of non-standard management reports.
Let's look at some examples of non-standard reports that can be configured in 1C:
sales analysis, profitability calculationand ABC \ - analysis. These reports provide
real management benefits and help you find hidden problems and
growth points.
Get a quick consultation-Telegram – click don't be afraid - t.me/soft_bis
Sales analysis: not just numbers, but conclusions
Regular ** Sales report shows how and what was sold during the period. But this is not enough.
To make decisions, it is important to see the sales structure: by product, category,
region, customer, manager. It is even more important tocompare ** indicators by
period, to identify ** trendsand ** deviations.
For example, you can develop a report that will show:
TOP-10 products sold with
monthly dynamics;the share of each product in the total
revenue;average receipt for each client
or to the manager;the amount of repeated purchases
clients;sales by region in the background
planned values.
These reports ** allow you to quickly see ** what is growing and what is falling, where there is potential
and where there are risks. If you automate the formation of such slices in 1C,
the manager will get a visual picture of sales in a couple of clicks.
Profitability: Evaluating performance, not just
revenue
Services Non-standard 1C reports (sales analysis, profitability, ABC analysis) → more
Sales — not yet a success. You can sell a lot, but in the negative. Therefore, it is extremely important to consider
costs, especially variables: purchase price, logistics, bonuses,
commissions.
A non-standard report on **profitability ** allows you to draw conclusions about how effectively
products, employees, or sales channels work. Here are the blocks
that such a report can include::
gross profit for each
product and customer;profitability by category
or brands;comparative analysis by
managers: who brings more profit, not just turnover;the impact of discounts on the profitability of the company.** Simple ** example: two products sell equally well, but one brings 10% margin, and
the other-40% profit. Without a ROI report, it's easy to lose sight of this and
invest resources in the wrong direction.
In 1C, you can automate the calculation of profitability using processing or a separate
report that will take into account all the necessary cost items. The main thing
is to set the correct methodology: take into account purchase prices on the sale date, write-off bonuses,
taxes, and so on.
ABC\ - Analysis: Sales priorities
ABC \ analysis is a simple but powerful segmentation method. It divides products, customers, or
categories into three groups:
A — the most important ones, giving up to 80%
profits;B — average by significance;
C — the least significant, but
often numerous.
ABC \ - analysis makes
it possible to focus on what really affects the business.
For example, you can create a report in 1C that shows:
what 20% of positions generate 80% of revenue;
what clients generate
basic profit;how the structure changes
ABC-groups by time.
Often it turns out that companies spend resources on the C\group: they place orders,
deliver, and serve, but this almost does not bring any profit. This report helps
you optimize your product range, marketing, and sales channels.
In 1C, you can implement ABC \ - analysis based on the "Universal Report" with the addition
of ranking logic and calculation of shares. This is not difficult and gives a tangible effect. Where can I get such reports?If you work with standard configurations like 1C:Trade management, 1C: ERP
or 1C:UNF, then the required data is already in the \ database. You just need
to collect them correctly and present them to the user. This can be done via:
Processing or external reports (development
on the SKD or in the code);Customized reports inside the configuration with
updating dimensions;Upload to Excel with subsequent analysis (less than
convenient, but possible).
Usually, creating such reports is a task for a 1C programmer or an analyst. However, if
you set a clear technical specification, many reports can be collected fairly quickly, especially if
the data structure is already established.
Why this is important
Not popular management reports in 1C — this is not about "beauty". This is a tool that
allows you to:
make decisions based on real data.
data, not intuition;notice problems in time;
understand the real profit, but not the real profit.
just revenue;optimize your product range and
sales;set the right priorities.
The faster a business learns to look not just at numbers, but analyze them, the
higher its sustainability and competitiveness will be. And 1C, if properly
configured, can become a powerful analytics tool.
Leave a Comment